Using GCC with MinGW
In this tutorial, you configure Visual Studio Code to use the GCC C++ compiler (g++) and GDB debugger from mingw-w64 to create programs that run on Windows.
After configuring VS Code, you will compile and debug a simple Hello World program in VS Code. This tutorial does not teach you about GCC, GDB, Mingw-w64, or the C++ language. For those subjects, there are many good resources available on the Web.
If you have any problems, feel free to file an issue for this tutorial in the VS Code documentation repository.
Prerequisites
To successfully complete this tutorial, you must do the following steps:
-
Install Visual Studio Code.
-
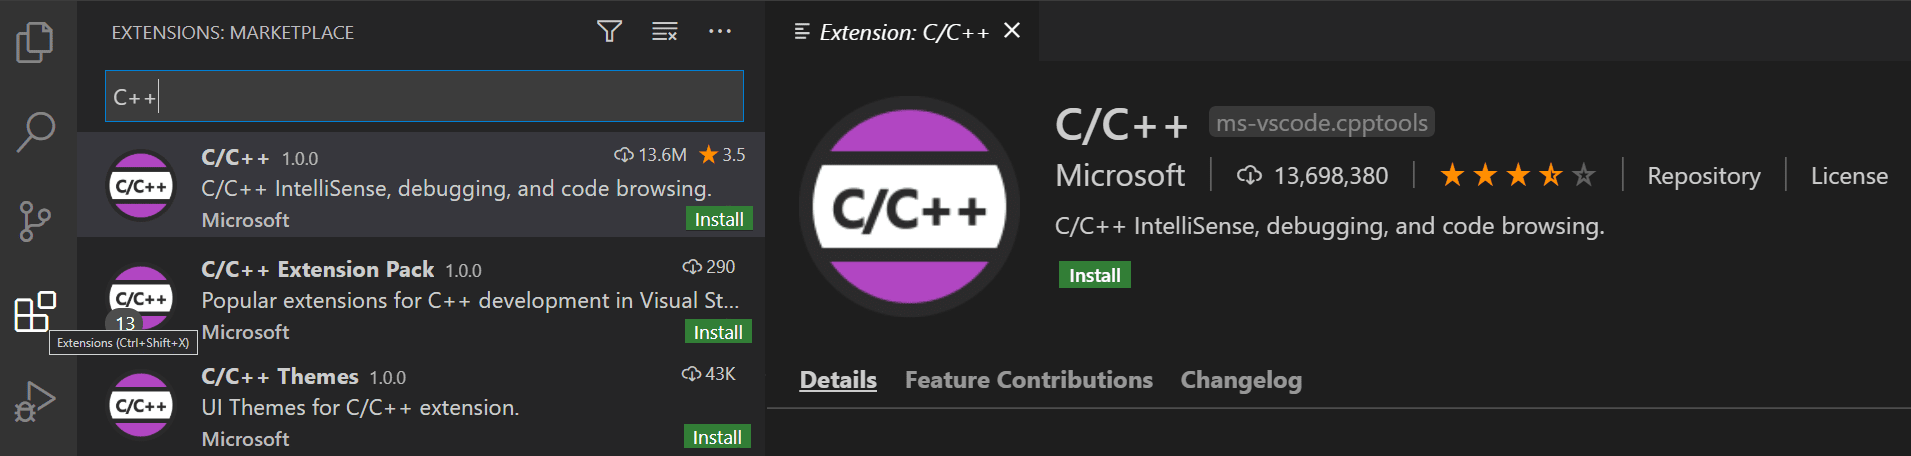
Install the C/C++ extension for VS Code. You can install the C/C++ extension by searching for 'c++' in the Extensions view (⇧⌘X (Windows, Linux Ctrl+Shift+X)).
-
Get the latest version of Mingw-w64 via MSYS2, which provides up-to-date native builds of GCC, Mingw-w64, and other helpful C++ tools and libraries. You can download the latest installer from the MSYS2 page or use this link to the installer.
-
Follow the Installation instructions on the MSYS2 website to install Mingw-w64. Take care to run each required Start menu and
pacmancommand. -
Install the Mingw-w64 toolchain (
pacman -S --needed base-devel mingw-w64-x86_64-toolchain). Run thepacmancommand in a MSYS2 terminal. Accept the default to install all the members in thetoolchaingroup. -
Add the path to your Mingw-w64
binfolder to the WindowsPATHenvironment variable by using the following steps:- In the Windows search bar, type 'settings' to open your Windows Settings.
- Search for Edit environment variables for your account.
- Choose the
Pathvariable in your User variables and then select Edit. - Select New and add the Mingw-w64 destination folder path to the system path. The exact path depends on which version of Mingw-w64 you have installed and where you installed it. If you used the settings above to install Mingw-w64, then add this to the path:
C:\msys64\mingw64\bin. - Select OK to save the updated PATH. You will need to reopen any console windows for the new PATH location to be available.
Check your MinGW installation
To check that your Mingw-w64 tools are correctly installed and available, open a new Command Prompt and type:
gcc --version
g++ --version
gdb --version
- If you don't see the expected output or
g++orgdbis not a recognized command, make sure your PATH entry matches the Mingw-w64 binary location where the compilers are located. If the compilers do not exist at that PATH entry, make sure you followed the instructions on the MSYS2 website to install Mingw-w64. - If
gcchas the correct output but notgdb, then you need to install the packages you are missing from the Mingw-w64 toolset.- Missing the
mingw-w64-gdbpackage is one cause of the "The value of miDebuggerPath is invalid." message upon attempted compilation if your PATH is correct.
- Missing the
Create Hello World
From a Windows command prompt, create an empty folder called projects where you can place all your VS Code projects. Then create a sub-folder called helloworld, navigate into it, and open VS Code in that folder by entering the following commands:
mkdir projects
cd projects
mkdir helloworld
cd helloworld
code .
The "code ." command opens VS Code in the current working folder, which becomes your "workspace". Accept the Workspace Trust dialog by selecting Yes, I trust the authors since this is a folder you created.
As you go through the tutorial, you will see three files created in a .vscode folder in the workspace:
tasks.json(build instructions)launch.json(debugger settings)c_cpp_properties.json(compiler path and IntelliSense settings)
Add a source code file
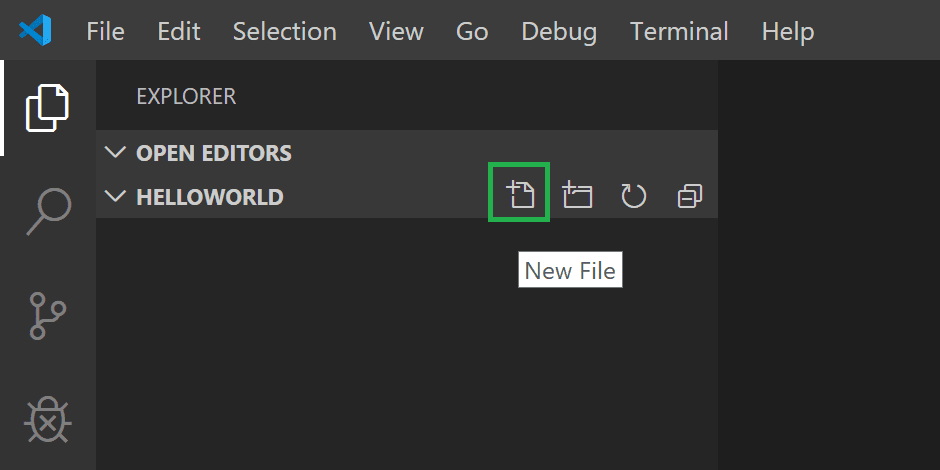
In the File Explorer title bar, select the New File button and name the file helloworld.cpp.
Add hello world source code
Now paste in this source code:
#include <iostream>
#include <vector>
#include <string>

using namespace std;

int main()
{
    vector<string> msg {"Hello", "C++", "World", "from", "VS Code", "and the C++ extension!"};

    for (const string& word : msg)
    {
        cout << word << " ";
    }
    cout << endl;
}
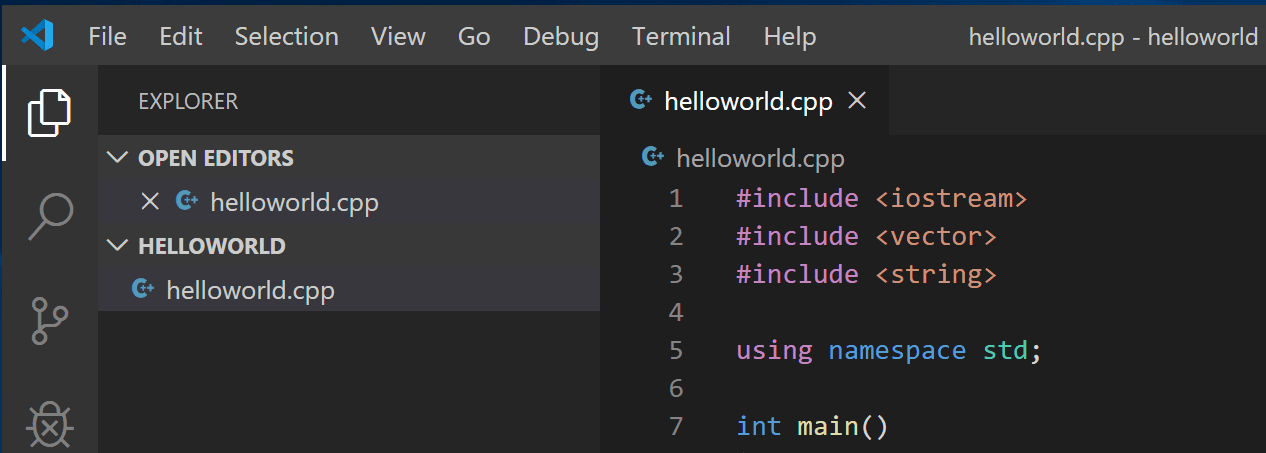
Now press ⌘S (Windows, Linux Ctrl+S) to save the file. Notice how the file you just added appears in the File Explorer view (⇧⌘E (Windows, Linux Ctrl+Shift+E)) in the side bar of VS Code:
You can also enable Auto Save to automatically save your file changes, by checking Auto Save in the main File menu.
The Activity Bar on the far left lets you open different views such as Search, Source Control, and Run. You'll look at the Run view later in this tutorial. You can find out more about the other views in the VS Code User Interface documentation.
Note: When you save or open a C++ file, you may see a notification from the C/C++ extension about the availability of an Insiders version, which lets you test new features and fixes. You can ignore this notification by selecting the
X(Clear Notification).
Explore IntelliSense
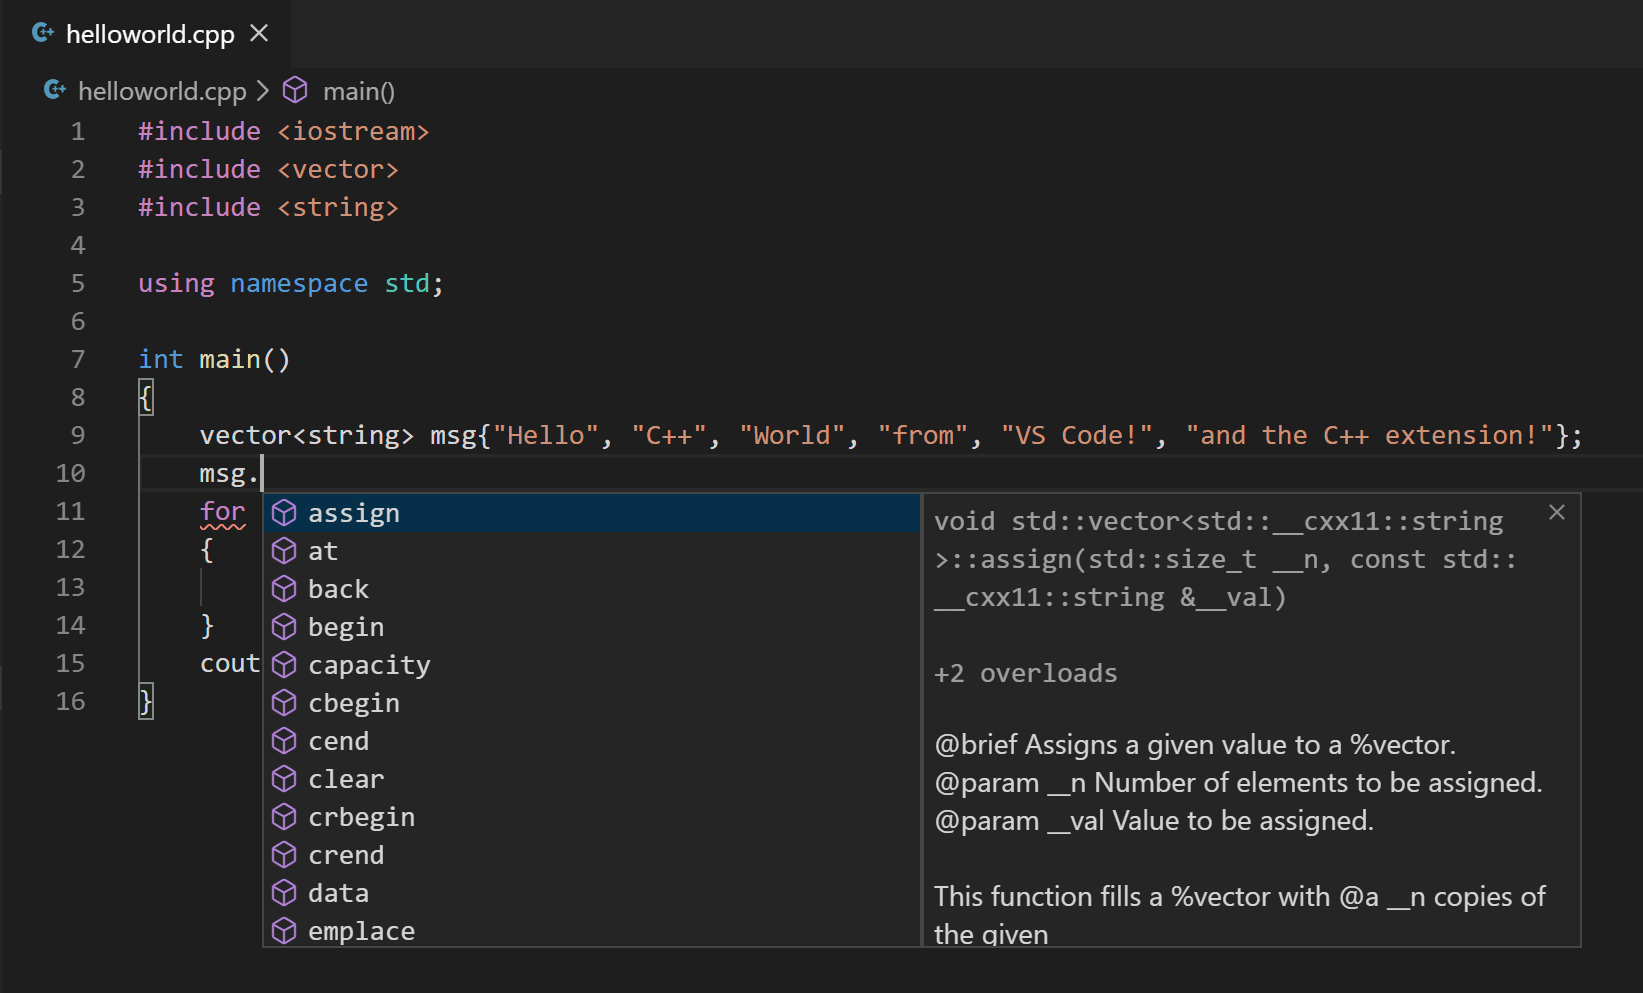
In your new helloworld.cpp file, hover over vector or string to see type information. After the declaration of the msg variable, start typing msg. as you would when calling a member function. You should immediately see a completion list that shows all the member functions, and a window that shows the type information for the msg object:
You can press the Tab key to insert the selected member; then, when you add the opening parenthesis, you will see information about any arguments that the function requires.
Run helloworld.cpp
Remember, the C++ extension uses the C++ compiler you have installed on your machine to build your program. Make sure you have a C++ compiler installed before attempting to run and debug helloworld.cpp in VS Code.
-
Open
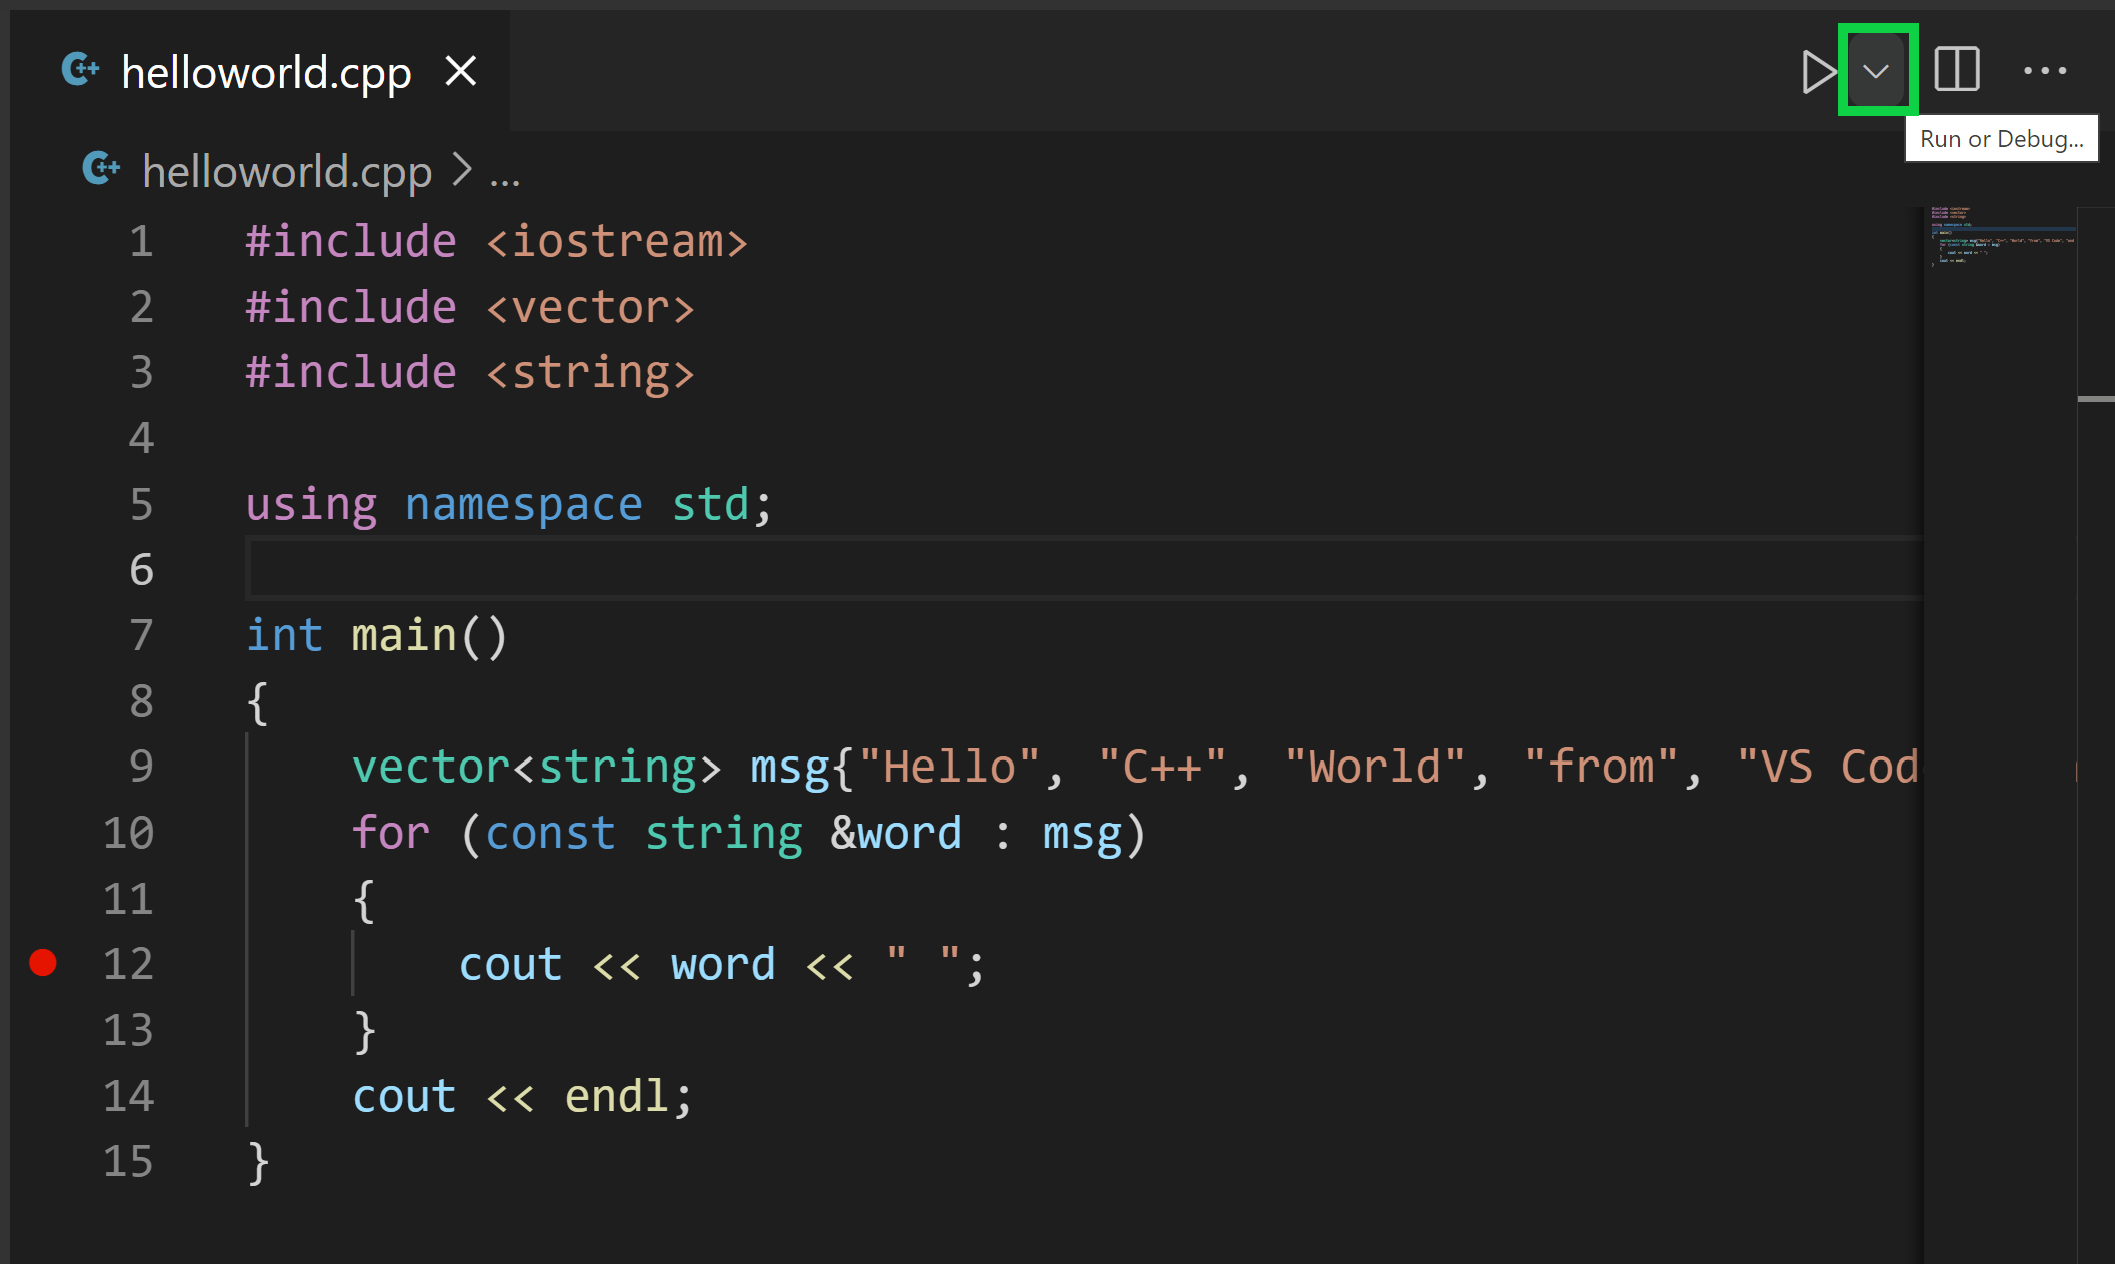
helloworld.cppso that it is the active file. -
Press the play button in the top right corner of the editor.
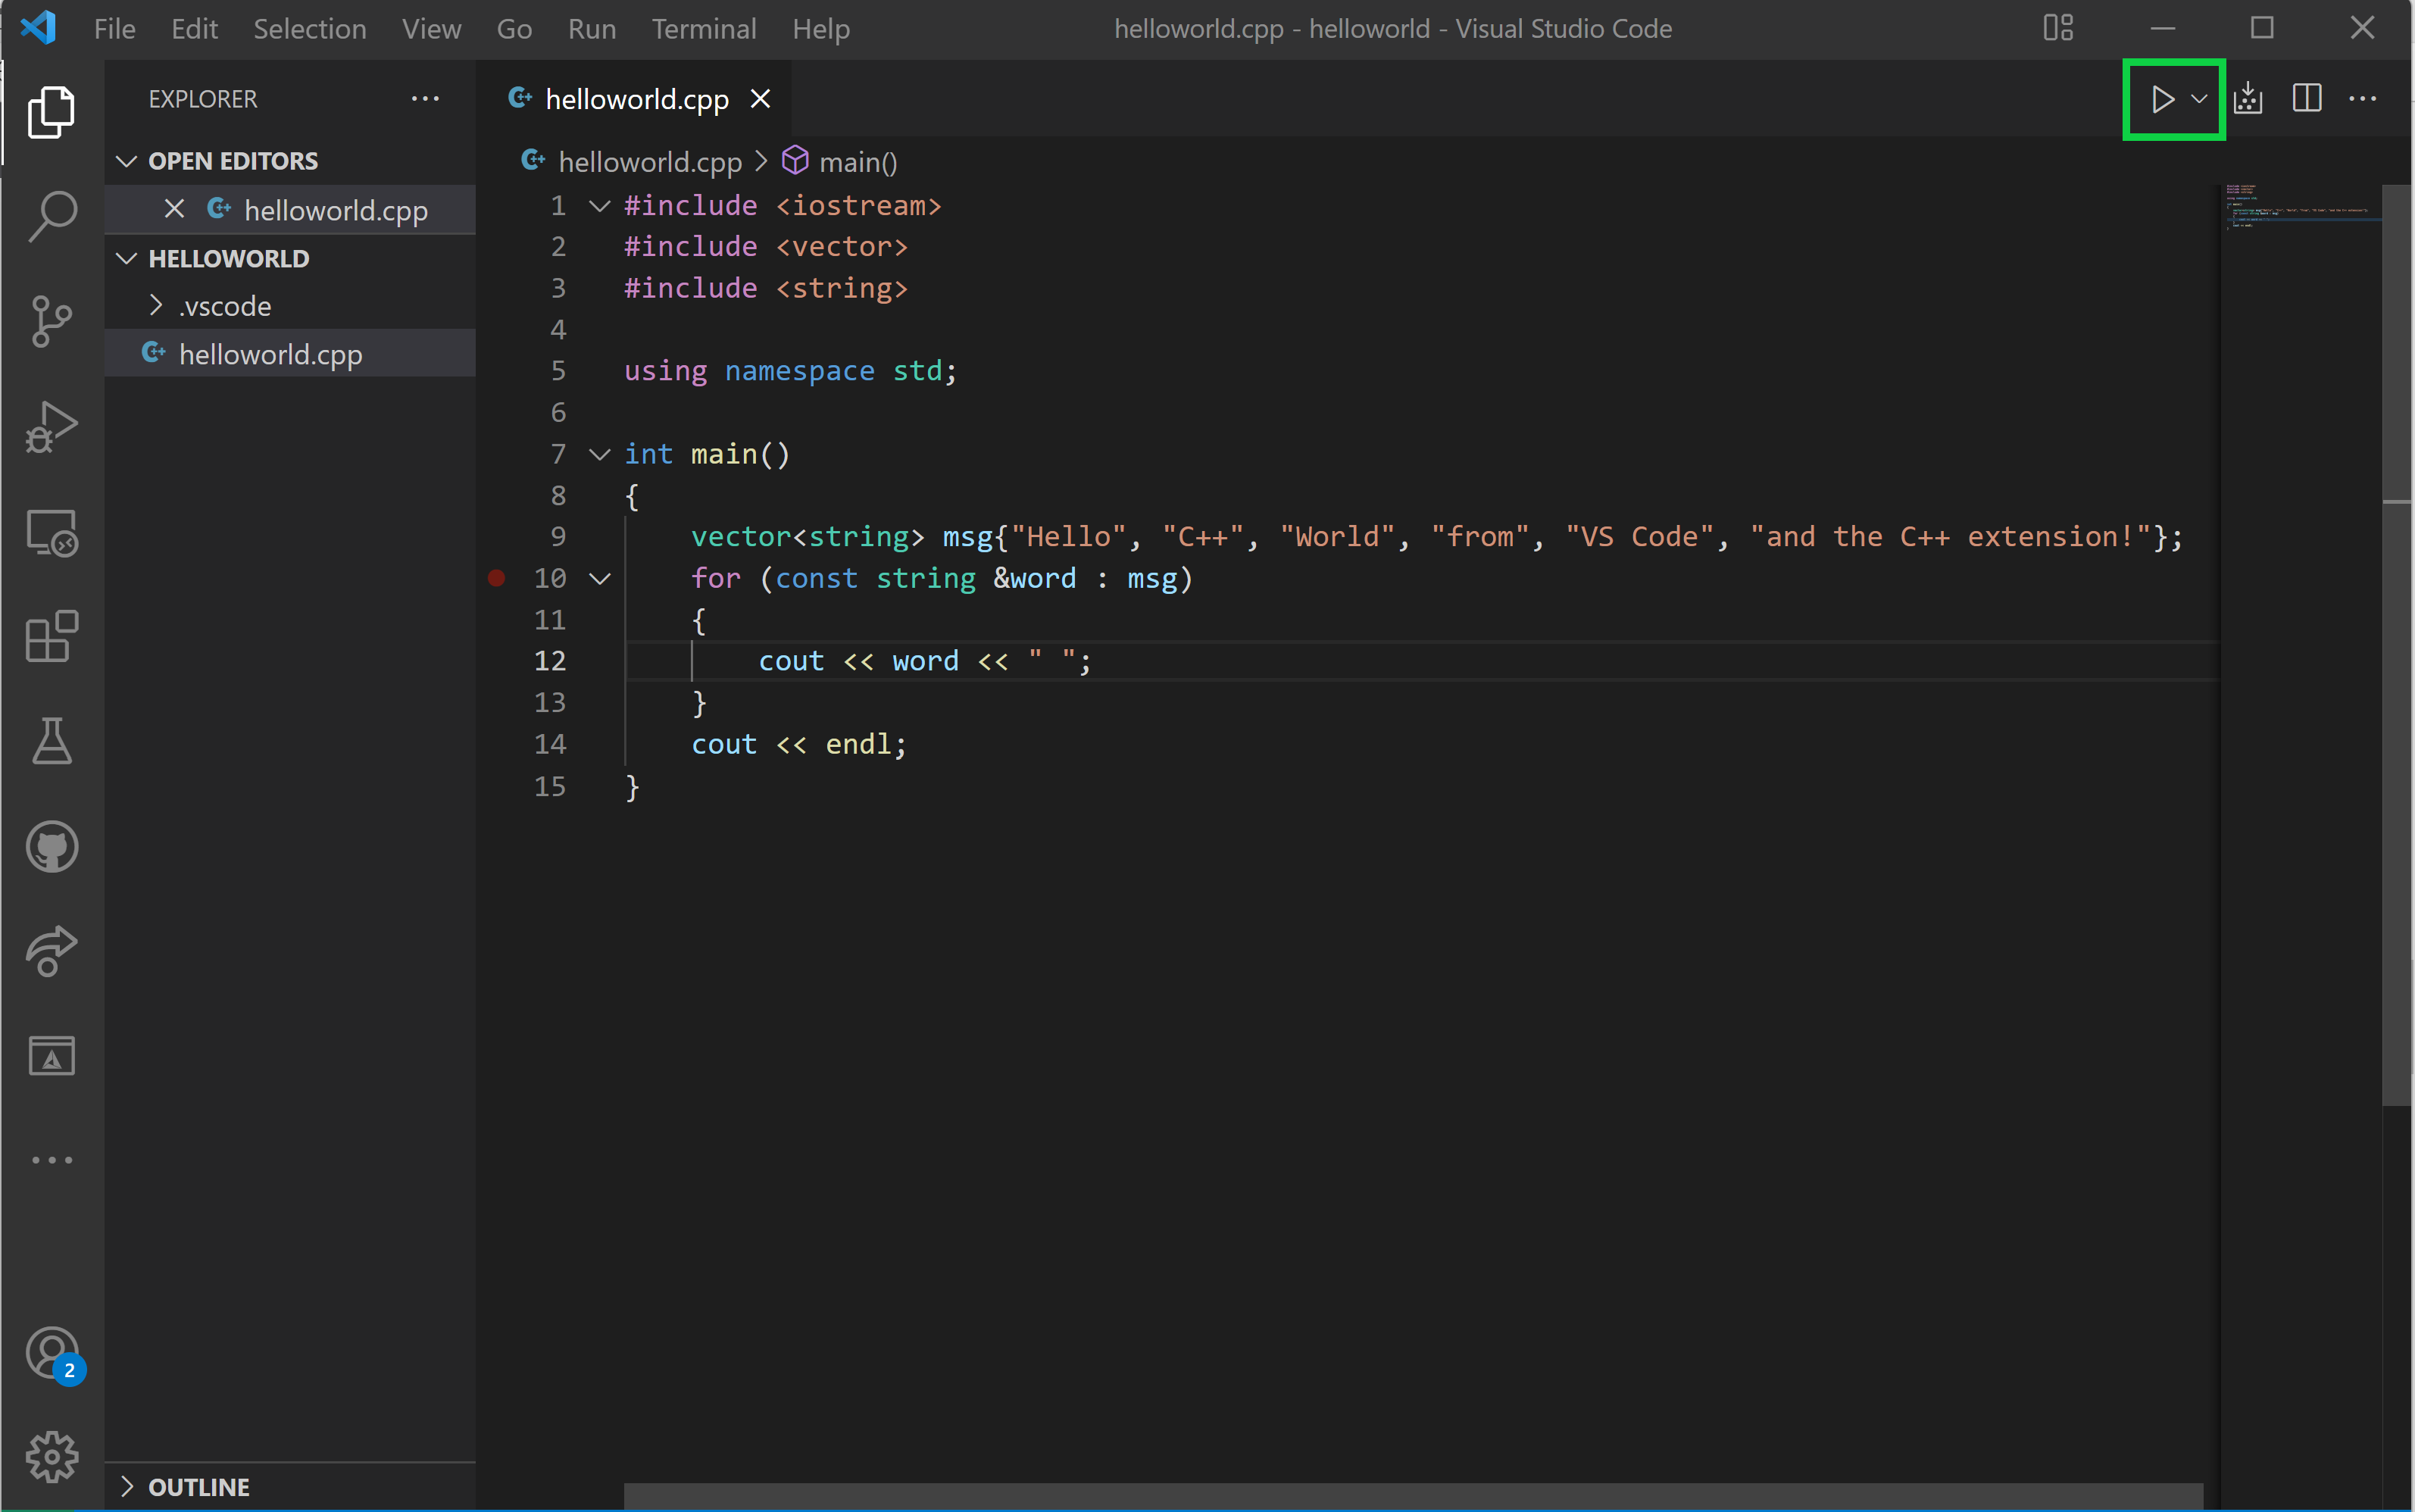
-
Choose C/C++: g++.exe build and debug active file from the list of detected compilers on your system.
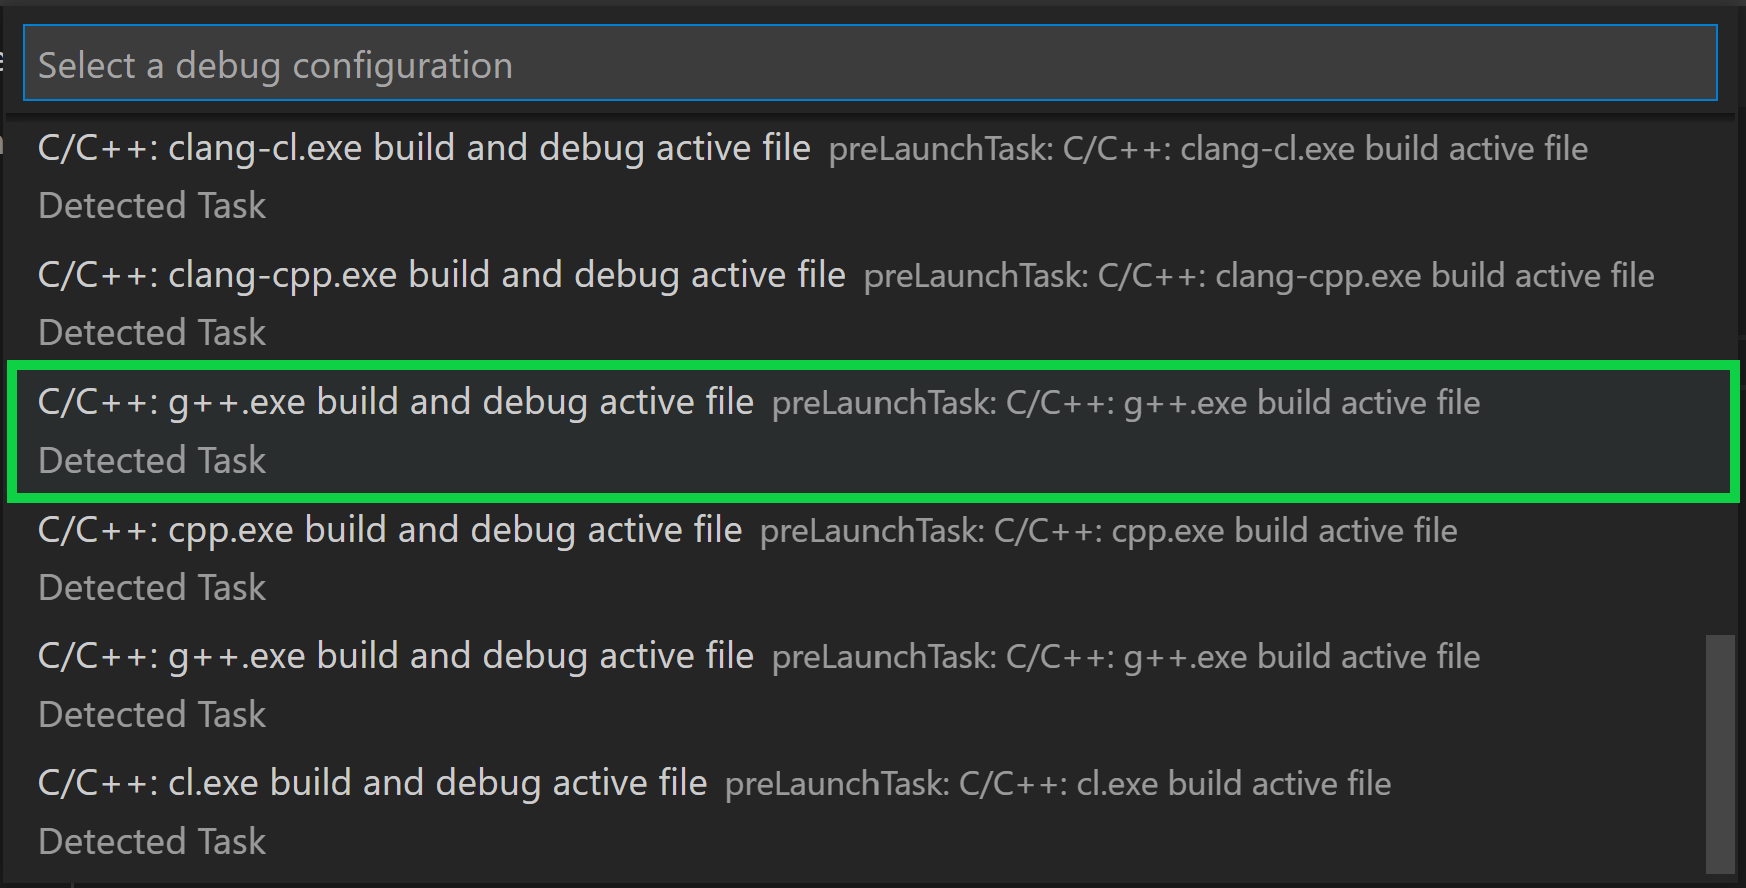
You'll only be asked to choose a compiler the first time you run helloworld.cpp. This compiler will be set as the "default" compiler in tasks.json file.
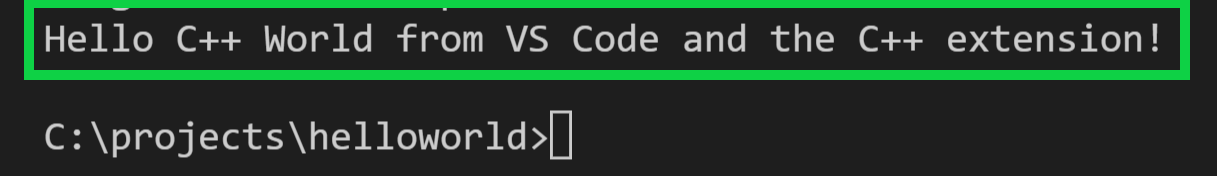
-
After the build succeeds, your program's output will appear in the integrated Terminal.
The first time you run your program, the C++ extension creates tasks.json, which you'll find in your project's .vscode folder. tasks.json stores build configurations.
Your new tasks.json file should look similar to the JSON below:
{
  "tasks": [
    {
      "type": "cppbuild",
      "label": "C/C++: g++.exe build active file",
      "command": "C:\\msys64\\mingw64\\bin\\g++.exe",
      "args": [
        "-fdiagnostics-color=always",
        "-g",
        "${file}",
        "-o",
        "${fileDirname}\\${fileBasenameNoExtension}.exe"
      ],
      "options": {
        "cwd": "${fileDirname}"
      },
      "problemMatcher": ["$gcc"],
      "group": {
        "kind": "build",
        "isDefault": true
      },
      "detail": "Task generated by Debugger."
    }
  ],
  "version": "2.0.0"
}
Note: You can learn more about
tasks.jsonvariables in the variables reference.
The command setting specifies the program to run; in this case that is g++.
The args array specifies the command-line arguments that will be passed to g++. These arguments must be specified in the order expected by the compiler.
This task tells g++ to take the active file (${file}), compile it, and create an executable file in the current directory (${fileDirname}) with the same name as the active file but with the .exe extension (${fileBasenameNoExtension}.exe), resulting in helloworld.exe for our example.
The label value is what you will see in the tasks list; you can name this whatever you like.
The detail value is what you will as the description of the task in the tasks list. It's highly recommended to rename this value to differentiate it from similar tasks.
From now on, the play button will read from tasks.json to figure out how to build and run your program. You can define multiple build tasks in tasks.json, and whichever task is marked as the default will be used by the play button. In case you need to change the default compiler, you can run Tasks: Configure default build task. Alternatively you can modify the tasks.json file and remove the default by replacing this segment:
    "group": {
        "kind": "build",
        "isDefault": true
    },
with this:
"group": "build",
Modifying tasks.json
You can modify your tasks.json to build multiple C++ files by using an argument like "${workspaceFolder}/*.cpp" instead of ${file}.This will build all .cpp files in your current folder. You can also modify the output filename by replacing "${fileDirname}\\${fileBasenameNoExtension}.exe" with a hard-coded filename (for example "${workspaceFolder}\\myProgram.exe").
Debug helloworld.cpp
- Go back to
helloworld.cppso that it is the active file. - Set a breakpoint by clicking on the editor margin or using F9 on the current line.
- From the drop-down next to the play button, select Debug C/C++ File.
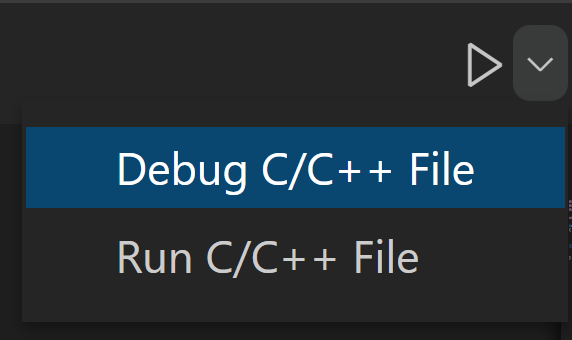
- Choose C/C++: g++ build and debug active file from the list of detected compilers on your system (you'll only be asked to choose a compiler the first time you run/debug
helloworld.cpp).
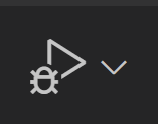
The play button has two modes: Run C/C++ File and Debug C/C++ File. It will default to the last-used mode. If you see the debug icon in the play button, you can just click the play button to debug, instead of using the drop-down.
Explore the debugger
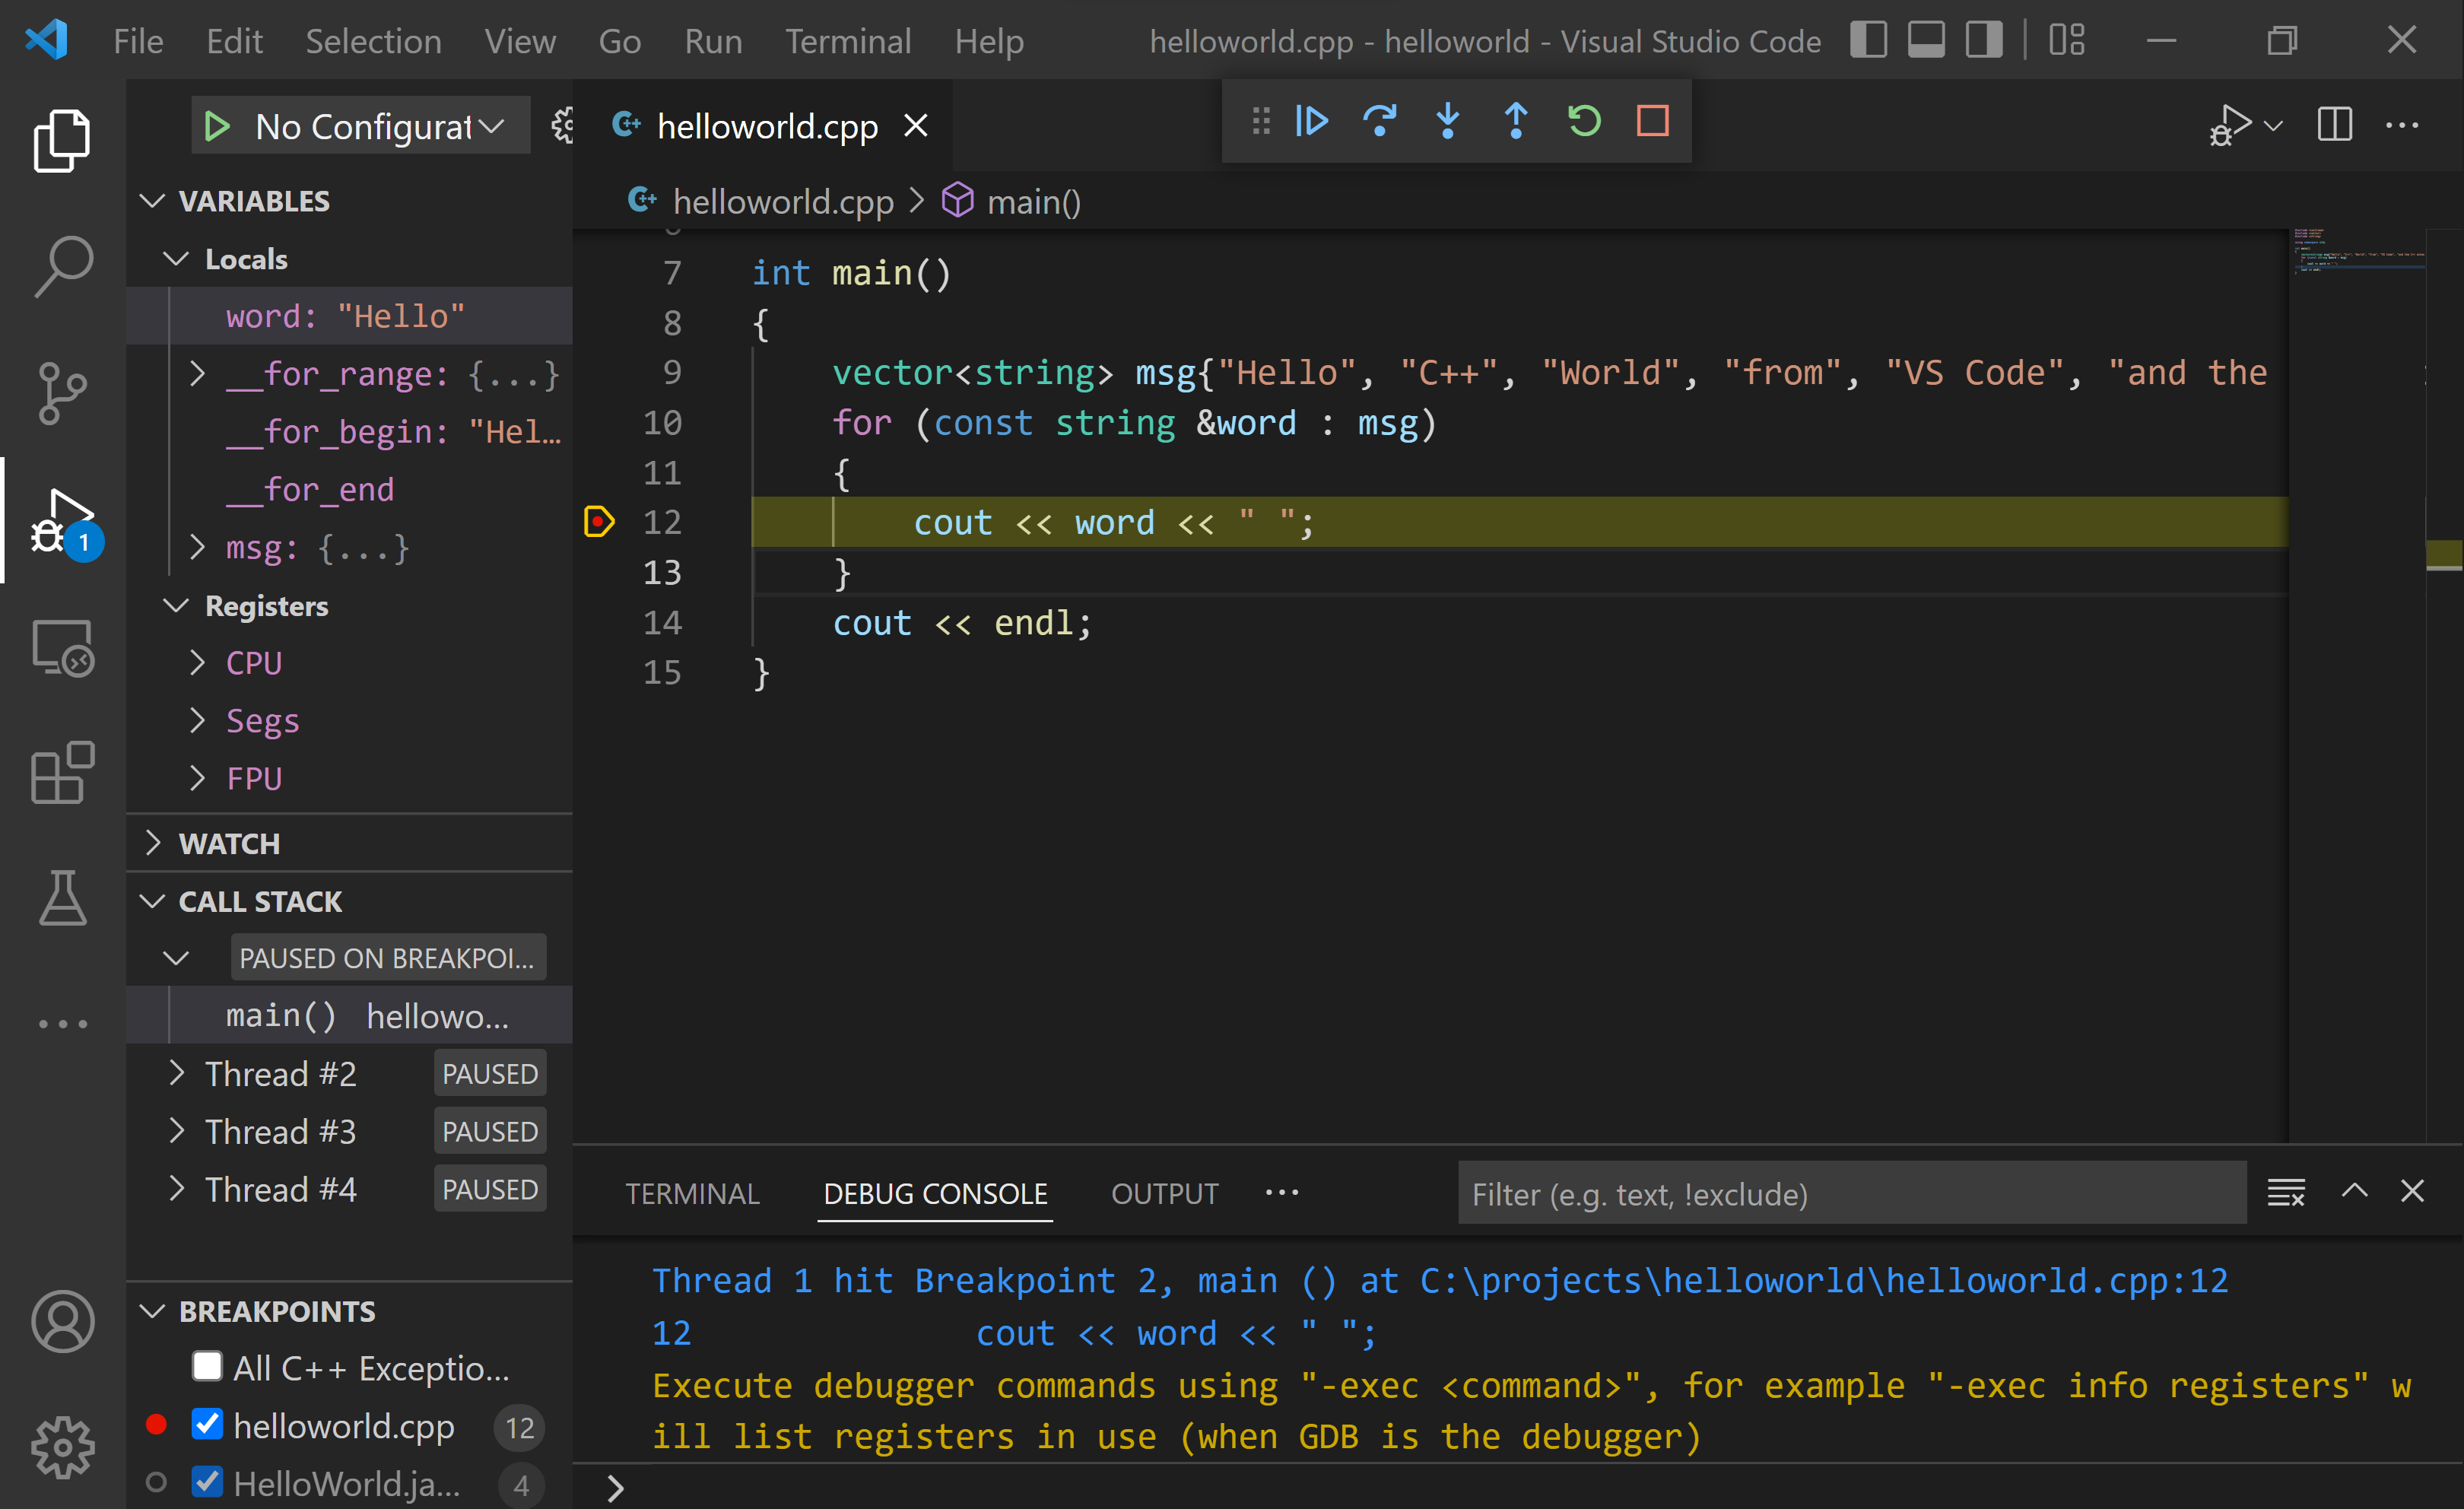
Before you start stepping through the code, let's take a moment to notice several changes in the user interface:
-
The Integrated Terminal appears at the bottom of the source code editor. In the Debug Output tab, you see output that indicates the debugger is up and running.
-
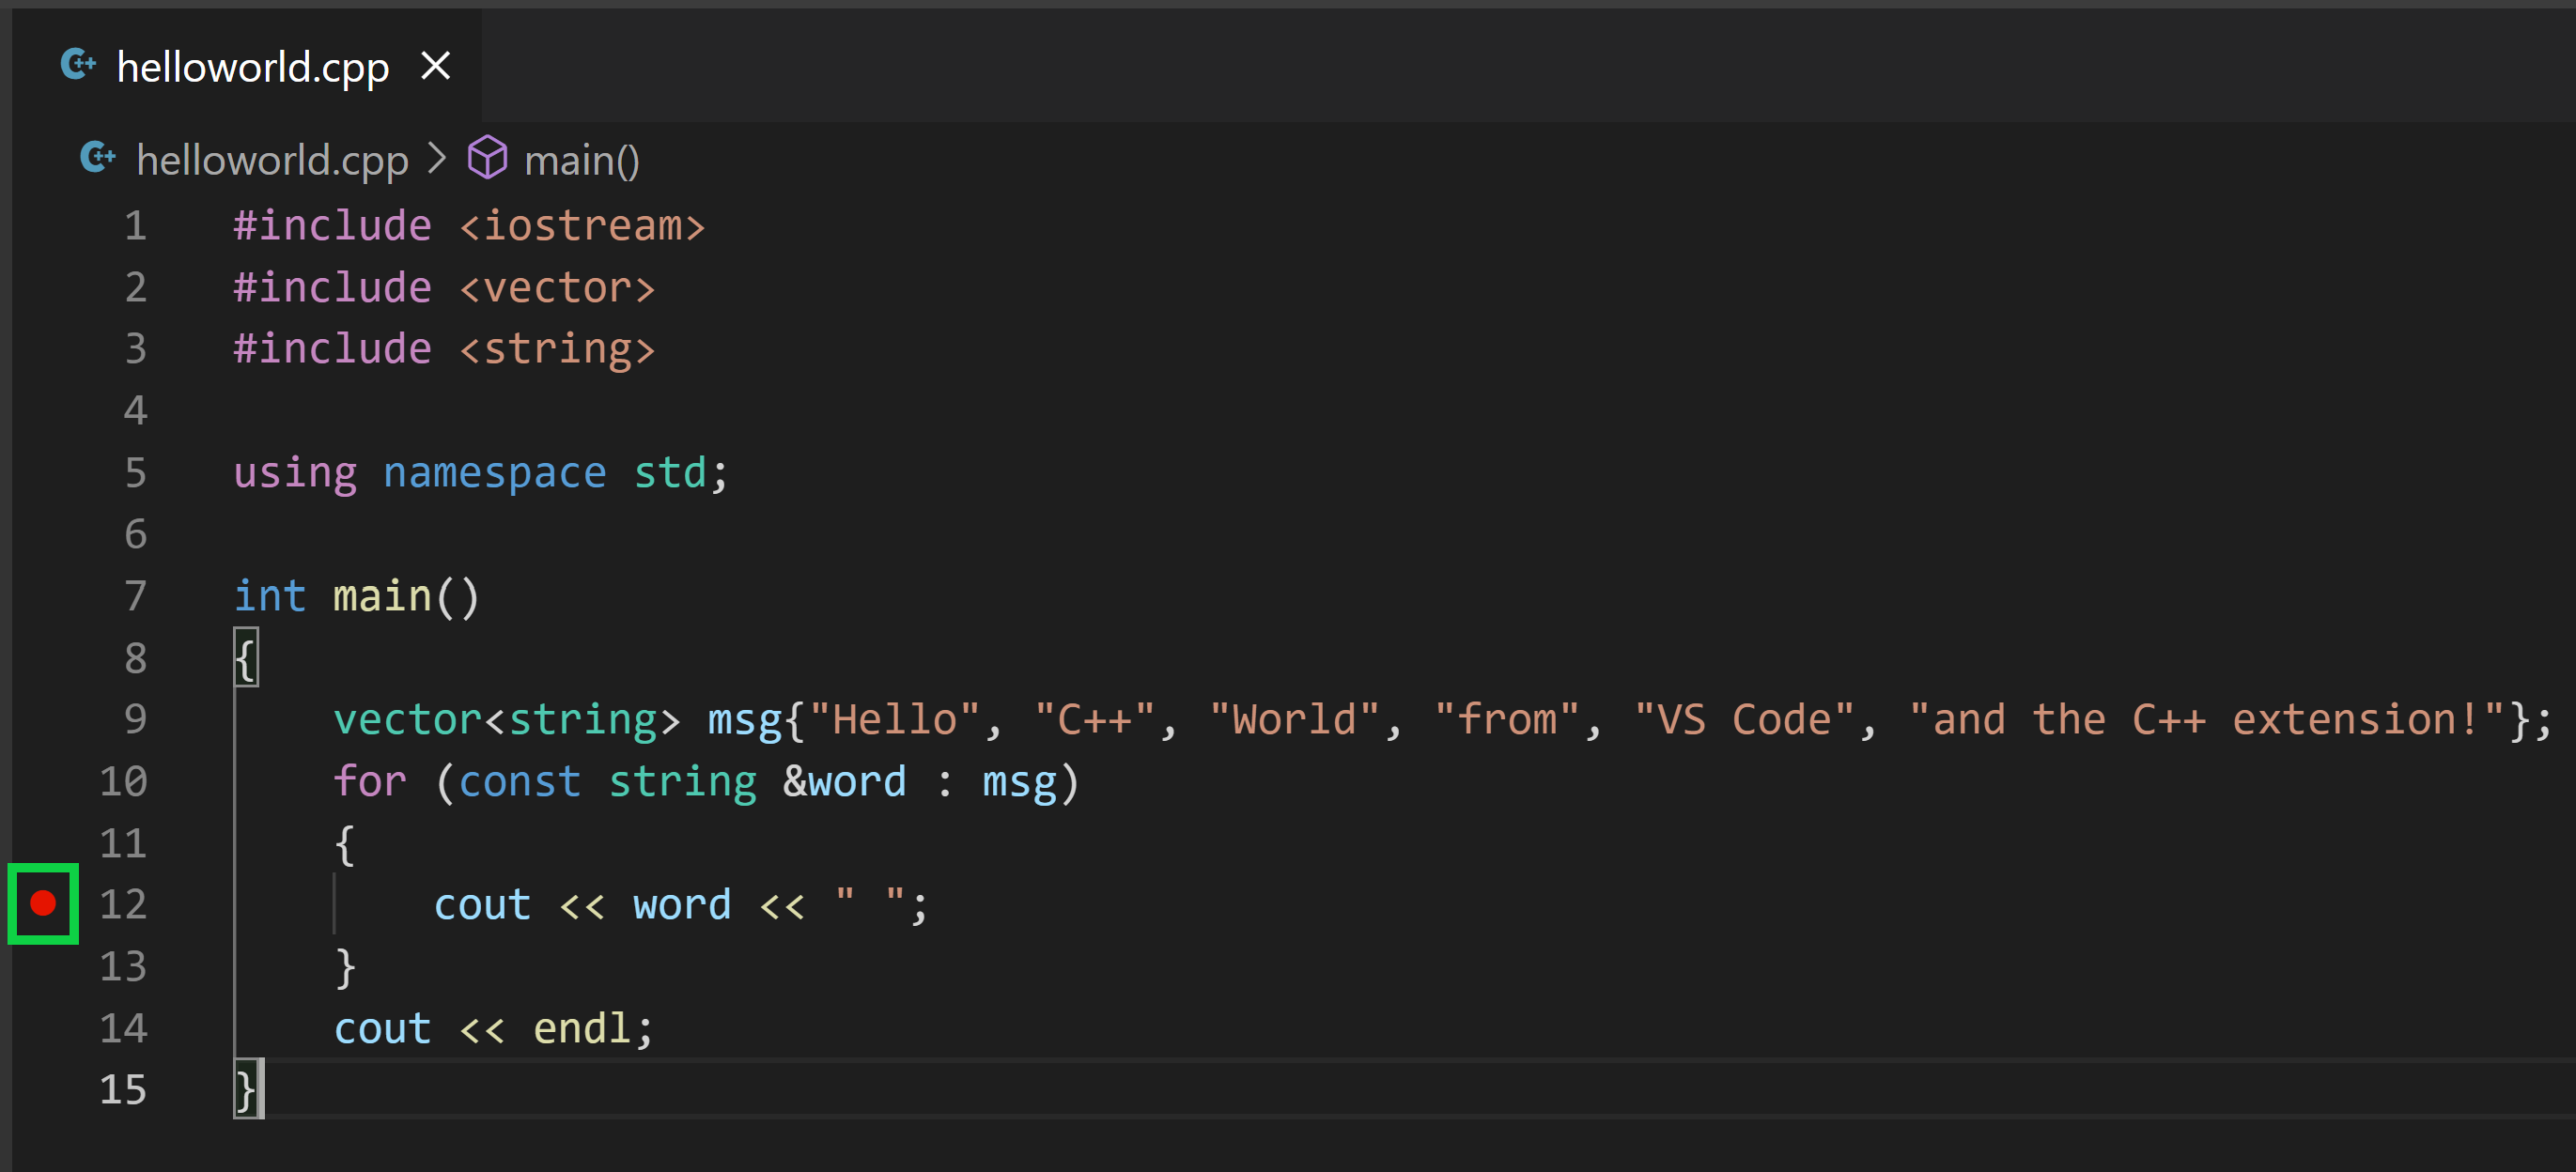
The editor highlights the line where you set a breakpoint before starting the debugger:
-
The Run and Debug view on the left shows debugging information. You'll see an example later in the tutorial.
-
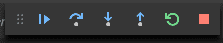
At the top of the code editor, a debugging control panel appears. You can move this around the screen by grabbing the dots on the left side.
Step through the code
Now you're ready to start stepping through the code.
-
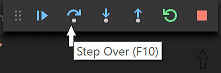
Click or press the Step over icon in the debugging control panel.
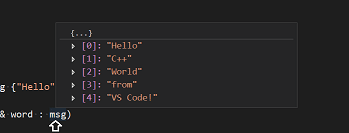
This will advance program execution to the first line of the for loop, and skip over all the internal function calls within the
vectorandstringclasses that are invoked when themsgvariable is created and initialized. Notice the change in the Variables window on the left.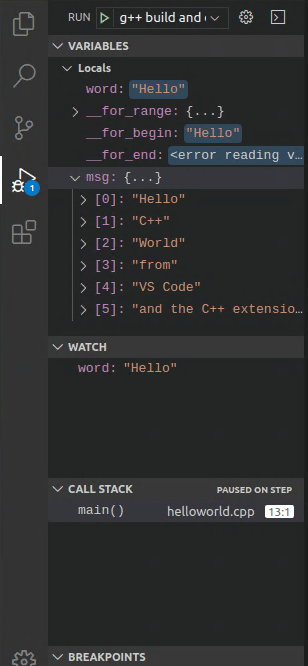
In this case, the errors are expected because, although the variable names for the loop are now visible to the debugger, the statement has not executed yet, so there is nothing to read at this point. The contents of
msgare visible, however, because that statement has completed. -
Press Step over again to advance to the next statement in this program (skipping over all the internal code that is executed to initialize the loop). Now, the Variables window shows information about the loop variables.
-
Press Step over again to execute the
coutstatement. (Note that as of the March 2019 release, the C++ extension does not print any output to the Debug Console until the loop exits.) -
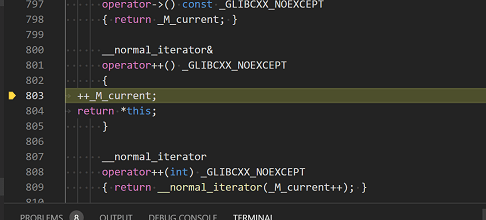
If you like, you can keep pressing Step over until all the words in the vector have been printed to the console. But if you are curious, try pressing the Step Into button to step through source code in the C++ standard library!
To return to your own code, one way is to keep pressing Step over. Another way is to set a breakpoint in your code by switching to the
helloworld.cpptab in the code editor, putting the insertion point somewhere on thecoutstatement inside the loop, and pressing F9. A red dot appears in the gutter on the left to indicate that a breakpoint has been set on this line.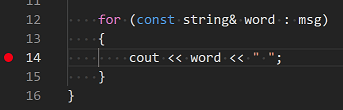
Then press F5 to start execution from the current line in the standard library header. Execution will break on
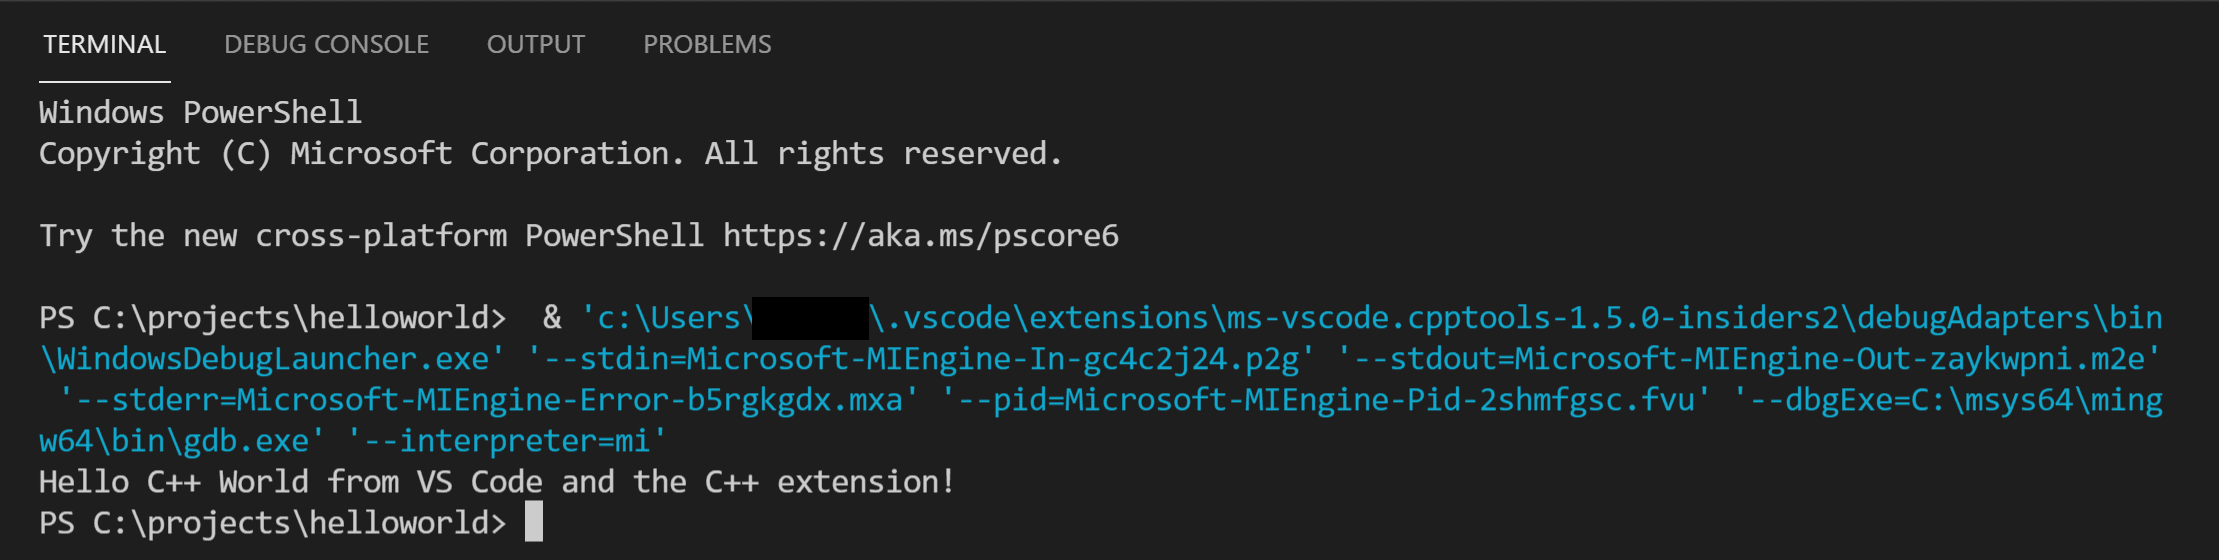
cout. If you like, you can press F9 again to toggle off the breakpoint.When the loop has completed, you can see the output in the Integrated Terminal, along with some other diagnostic information that is output by GDB.
Set a watch
Sometimes you might want to keep track of the value of a variable as your program executes. You can do this by setting a watch on the variable.
-
Place the insertion point inside the loop. In the Watch window, click the plus sign and in the text box, type
word, which is the name of the loop variable. Now view the Watch window as you step through the loop.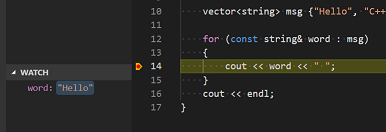
-
Add another watch by adding this statement before the loop:
int i = 0;. Then, inside the loop, add this statement:++i;. Now add a watch forias you did in the previous step. -
To quickly view the value of any variable while execution is paused on a breakpoint, you can hover over it with the mouse pointer.
Customize debugging with launch.json
When you debug with the play button or F5, the C++ extension creates a dynamic debug configuration on the fly.
There are cases where you'd want to customize your debug configuration, such as specifying arguments to pass to the program at runtime. You can define custom debug configurations in a launch.json file.
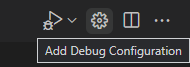
To create launch.json, choose Add Debug Configuration from the play button drop-down menu.
You'll then see a dropdown for various predefined debugging configurations. Choose C/C++: g++.exe build and debug active file.
VS Code creates a launch.json file, which looks something like this:
{
  "version": "0.2.0",
  "configurations": [
    {
      "name": "C/C++: g++.exe build and debug active file",
      "type": "cppdbg",
      "request": "launch",
      "program": "${fileDirname}\\${fileBasenameNoExtension}.exe",
      "args": [],
      "stopAtEntry": false,
      "cwd": "${fileDirname}",
      "environment": [],
      "externalConsole": false,
      "MIMode": "gdb",
      "miDebuggerPath": "C:\\msys64\\mingw64\\bin\\gdb.exe",
      "setupCommands": [
        {
          "description": "Enable pretty-printing for gdb",
          "text": "-enable-pretty-printing",
          "ignoreFailures": true
        }
      ],
      "preLaunchTask": "C/C++: g++.exe build active file"
    }
  ]
}
In the JSON above, program specifies the program you want to debug. Here it is set to the active file folder (${fileDirname}) and active filename with the .exe extension (${fileBasenameNoExtension}.exe), which if helloworld.cpp is the active file will be helloworld.exe. The args property is an array of arguments to pass to the program at runtime.
By default, the C++ extension won't add any breakpoints to your source code and the stopAtEntry value is set to false.
Change the stopAtEntry value to true to cause the debugger to stop on the main method when you start debugging.
From now on, the play button and F5 will read from your
launch.jsonfile when launching your program for debugging.
C/C++ configurations
If you want more control over the C/C++ extension, you can create a c_cpp_properties.json file, which will allow you to change settings such as the path to the compiler, include paths, C++ standard (default is C++17), and more.
You can view the C/C++ configuration UI by running the command C/C++: Edit Configurations (UI) from the Command Palette (⇧⌘P (Windows, Linux Ctrl+Shift+P)).
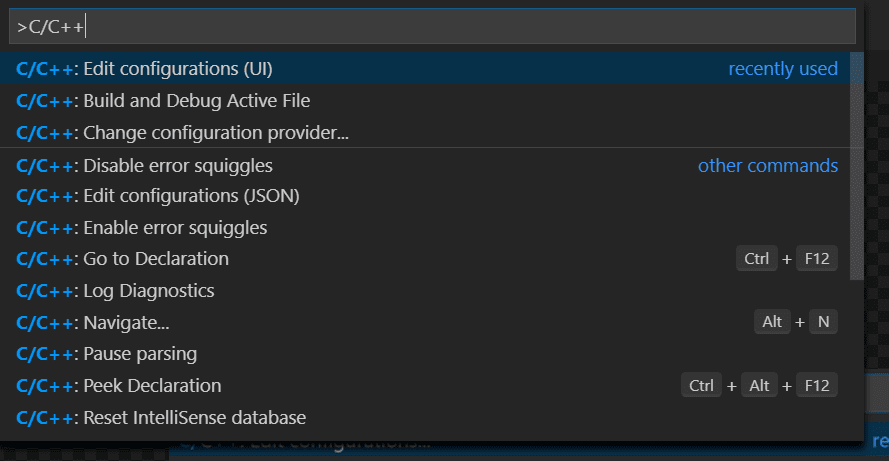
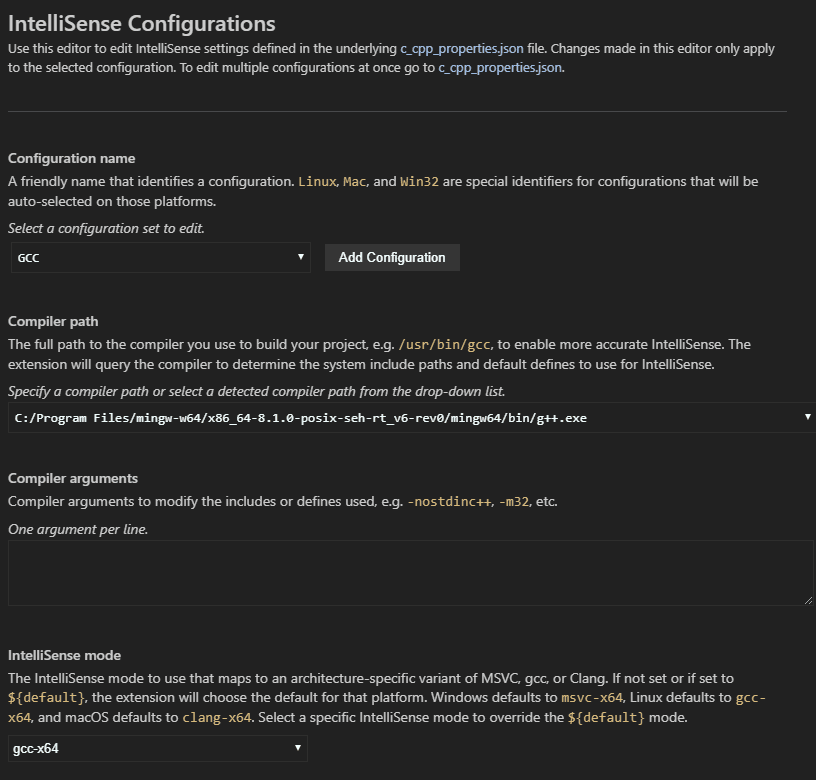
This opens the C/C++ Configurations page. When you make changes here, VS Code writes them to a file called c_cpp_properties.json in the .vscode folder.
Here, we've changed the Configuration name to GCC, set the Compiler path dropdown to the g++ compiler, and the IntelliSense mode to match the compiler (gcc-x64).
Visual Studio Code places these settings in .vscode\c_cpp_properties.json. If you open that file directly, it should look something like this:
{
  "configurations": [
    {
      "name": "GCC",
      "includePath": ["${workspaceFolder}/**"],
      "defines": ["_DEBUG", "UNICODE", "_UNICODE"],
      "windowsSdkVersion": "10.0.18362.0",
      "compilerPath": "C:/msys64/mingw64/bin/g++.exe",
      "cStandard": "c17",
      "cppStandard": "c++17",
      "intelliSenseMode": "windows-gcc-x64"
    }
  ],
  "version": 4
}
You only need to add to the Include path array setting if your program includes header files that are not in your workspace or in the standard library path.
Compiler path
The extension uses the compilerPath setting to infer the path to the C++ standard library header files. When the extension knows where to find those files, it can provide features like smart completions and Go to Definition navigation.
The C/C++ extension attempts to populate compilerPath with the default compiler location based on what it finds on your system. The extension looks in several common compiler locations.
The compilerPath search order is:
- First check for the Microsoft Visual C++ compiler
- Then look for g++ on Windows Subsystem for Linux (WSL)
- Then g++ for Mingw-w64.
If you have Visual Studio or WSL installed, you may need to change compilerPath to match the preferred compiler for your project. For example, if you installed Mingw-w64 version 8.1.0 using the i686 architecture, Win32 threading, and sjlj exception handling install options, the path would look like this: C:\Program Files (x86)\mingw-w64\i686-8.1.0-win32-sjlj-rt_v6-rev0\mingw64\bin\g++.exe.
Troubleshooting
MSYS2 is installed, but g++ and gdb are still not found
You must follow the steps on the MSYS2 website and use the MSYS CLI to install Mingw-w64, which contains those tools. You will also need to install the full Mingw-w64 toolchain (pacman -S --needed base-devel mingw-w64-x86_64-toolchain) to get the gdb debugger.
MinGW 32-bit
If you need a 32-bit version of the MinGW toolset, consult the Downloading section on the MSYS2 wiki. It includes links to both 32-bit and 64-bit installation options.
Next steps
- Explore the VS Code User Guide.
- Review the Overview of the C++ extension.
- Create a new workspace, copy your
.vscodeJSON files to it, adjust the necessary settings for the new workspace path, program name, and so on, and start coding!