Debugging
You can debug C# applications in Visual Studio Code using the Microsoft C# extension.
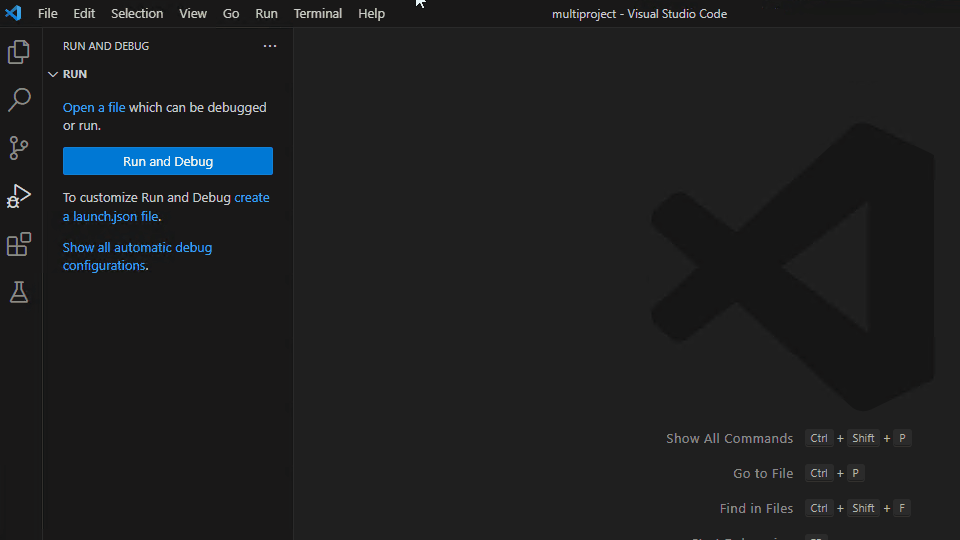
Run and Debug
The C# extension along with C# Dev Kit provides multiple ways to run and debug your C# application.
To run and debug without C# Dev Kit, see Microsoft C# extension's GitHub page for documentation.
Debug with F5
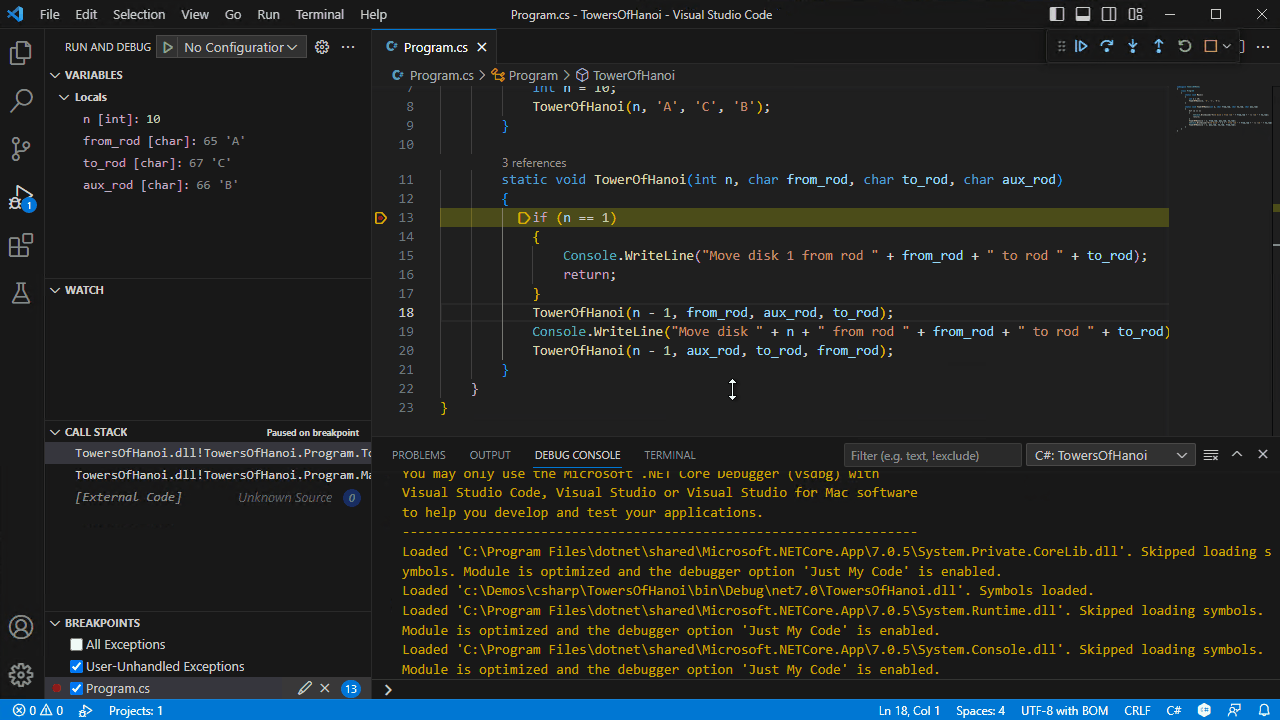
With the C# Dev Kit extension installed and no debug configurations available to select in the Debug view, you can start debugging your project by having a .cs file opened and then pressing F5. The debugger will automatically find your project and start debugging. If you have multiple projects, it will prompt for which project you would like to start debugging.
You can also start a debugging session from the Run and Debug view from the side bar of VS Code. See more at Debugging in VS Code.
Debug with Solution Explorer
With the C# Dev Kit extension installed, there is a Debug context menu when you right-click on your project in the Solution Explorer.
There are three options:
- Start New Instance - This starts your project with a debugger attached.
- Start without Debugging - This runs your project without a debugger attached.
- Step into New Instance - This starts your project with a debugger attached but stops at the entrypoint of your code.
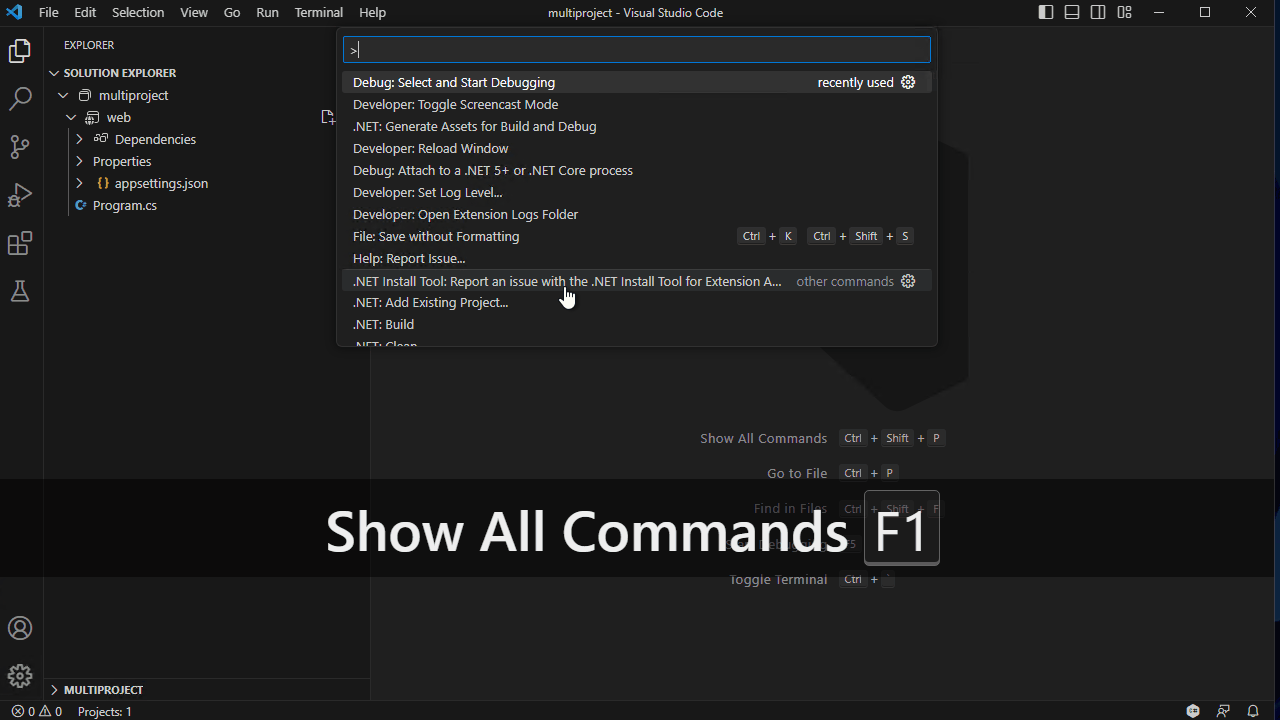
Debug with Command Palette
With the C# Dev Kit extension installed, you can also start debugging from the Command Palette ⇧⌘P (Windows, Linux Ctrl+Shift+P) by using the Debug: Select and Start Debugging command.
Note: This adds a launch configuration entry to your debug dropdown list.
Debug with dynamic (in-memory) launch configurations
With the C# Dev Kit extension installed, you can create dynamic launch configurations. How you create them depends if your project has an existing launch.json file.
Existing launch.json
If you have an existing launch.json, you can go to the Debug view, select the dropdown, and select the C# option. This should give you a selection of launch targets that you can add to your dropdown list. After selecting, you can hit F5 or Start Debugging with the newly generated configuration.
No launch.json
If you do not have a launch.json in your project, you can add and access these dynamic configurations in the Show all automatic debug configurations in the Debug view.
Removing dynamic (in-memory) launch configurations
You can remove the generated configurations with Command Palette ⇧⌘P (Windows, Linux Ctrl+Shift+P) and using the command Debug: Select and Start Debugging.
In the dropdown, it lists all your existing debug configurations. If you hover over the dynamic configurations, a clickable trashcan icon appears on the right. You can select that icon to remove the dynamic configuration.
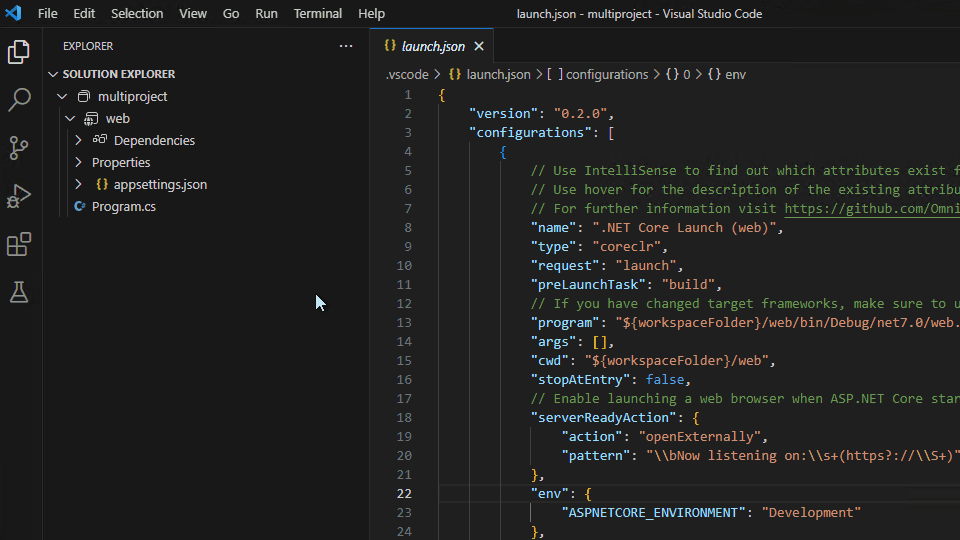
Debug with launch.json
If you are using the C# Dev Kit, we recommend not using this option. However, if you have the need to modify the debug configuration directly, see Configuring launch.json for C# debugging.
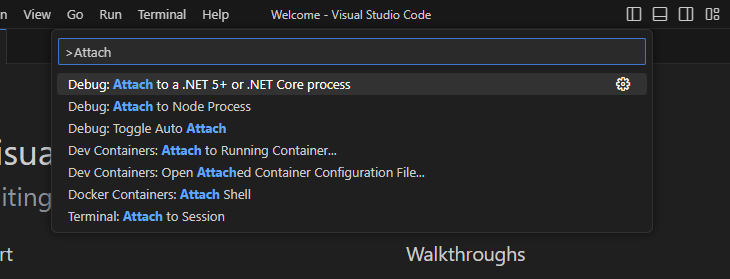
Attaching to a process
You can attach to a C# process using with the Command Palette ⇧⌘P (Windows, Linux Ctrl+Shift+P) and running the Debug: Attach to a .NET 5+ or .NET Core process command.
Configuration options
There are many options and settings available to configure the debugger. You can use launchSettings.json, VS Code User Settings to modify your debug options, or directly modify your launch.json.
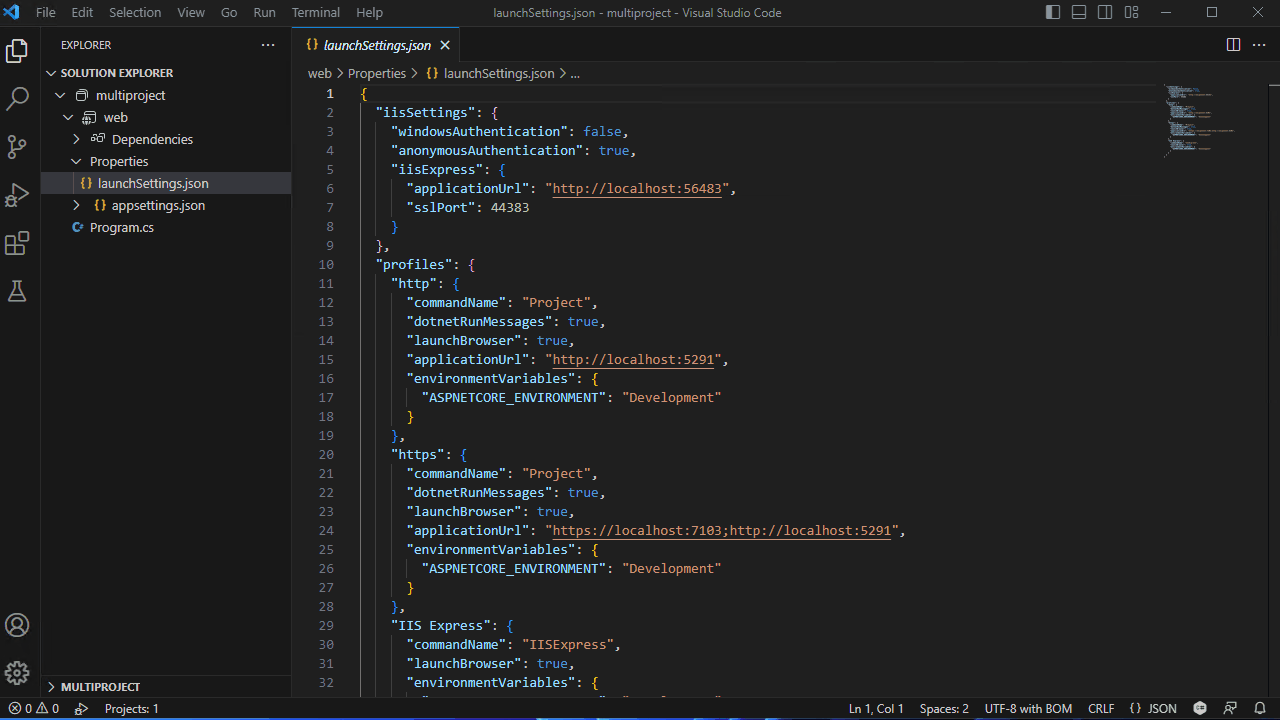
launchSettings.json
If you have launchSettings.json from Visual Studio, you should see your profiles listed using Run from F5 or Run from Command Palette.
Refer to Configuring C# debugging for more details.
User settings
If you have settings that you wish to change while using the C# debugger, you can find these options under File > Preferences > Settings (⌘, (Windows, Linux Ctrl+,)) and searching for these options.
csharp.debug.stopAtEntry- If true, the debugger should stop at the entry point of the target. This option defaults tofalse.csharp.debug.console- When launching console projects, indicates which console the target program should be launched into. Note: This option is only used for the 'dotnet' debug configuration type.internalConsole- Output to the VS Code Debug Console. This doesn't support reading console input (ex:Console.ReadLine).integratedTerminal- VS Code's integrated terminal.externalTerminal- External terminal that can be configured via user settings.
csharp.debug.sourceFileMap- Maps build-time paths to local source locations. All instances of build-time path will be replaced with the local source path.
Example:
{\"<build-path>\":\"<local-source-path>\"}csharp.debug.justMyCode- When enabled (the default), the debugger only displays and steps into user code ("My Code"), ignoring system code and other code that is optimized or that does not have debugging symbols. More information.csharp.debug.requireExactSource- Flag to require current source code to match the pdb. This option defaults totrue.csharp.debug.enableStepFiltering- Flag to enable stepping over Properties and Operators. This option defaults totrue.csharp.debug.logging.exceptions- Flag to determine whether exception messages should be logged to the output window. This option defaults totrue.csharp.debug.logging.moduleLoad- Flag to determine whether module load events should be logged to the output window. This option defaults totrue.csharp.debug.logging.programOutput- Flag to determine whether program output should be logged to the output window when not using an external console. This option defaults totrue.csharp.debug.logging.engineLogging- Flag to determine whether diagnostic engine logs should be logged to the output window. This option defaults tofalse.csharp.debug.logging.browserStdOut- Flag to determine if stdout text from the launching the web browser should be logged to the output window. This option defaults totrue.csharp.debug.logging.elapsedTiming- If true, engine logging includesadapterElapsedTimeandengineElapsedTimeproperties to indicate the amount of time, in microseconds, that a request took. This option defaults tofalse.csharp.debug.logging.threadExit- Controls if a message is logged when a thread in the target process exits. This option defaults tofalse.csharp.debug.logging.processExit- Controls if a message is logged when the target process exits, or debugging is stopped. This option defaults totrue.csharp.debug.suppressJITOptimizations- If true, when an optimized module (.dll compiled in the Release configuration) loads in the target process, the debugger asks the Just-In-Time compiler to generate code with optimizations disabled. More informationcsharp.debug.symbolOptions.searchPaths- Array of symbol server URLs (example:http://MyExampleSymbolServer) or directories (example: /build/symbols) to search for .pdb files. These directories will be searched in addition to the default locations next to the module and the path where the pdb was originally dropped to.csharp.debug.symbolOptions.searchMicrosoftSymbolServer- Iftruethe Microsoft Symbol server (https://msdl.microsoft.com/download/symbols) is added to the symbols search path. If unspecified, this option defaults tofalse.csharp.debug.symbolOptions.searchNuGetOrgSymbolServer- Iftruethe NuGet.org symbol server (https://symbols.nuget.org/download/symbols) is added to the symbols search path. If unspecified, this option defaults tofalse.csharp.debug.symbolOptions.cachePath- Directory where symbols downloaded from symbol servers should be cached. If unspecified, on Windows the debugger defaults to%TEMP%\\SymbolCache, and on Linux and macOS the debugger defaults to~/.dotnet/symbolcache. *-csharp.debug.symbolOptions.moduleFilter.mode- Controls which of the two basic operating modes the module filter operates in.loadAllButExcluded- Load symbols for all modules unless the module is in theexcludedModulesarray.loadOnlyIncluded- Do not attempt to load symbols for ANY module unless it is in theincludedModulesarray, or it is included through theincludeSymbolsNextToModulessetting.
csharp.debug.symbolOptions.moduleFilter.excludedModules- Array of modules that the debugger should NOT load symbols for. Wildcards (example: MyCompany.*.dll) are supported. This property is ignored unlessmodeis set toloadAllButExcluded.csharp.debug.symbolOptions.moduleFilter.includedModules- Array of modules that the debugger should load symbols for. Wildcards (example: MyCompany.*.dll) are supported. This property is ignored unlessmodeis set toloadOnlyIncluded.csharp.debug.symbolOptions.moduleFilter.includeSymbolsNextToModules- If true, for any module NOT in theincludedModulesarray, the debugger will still check next to the module itself and the launching executable, but it will not check paths on the symbol search list. This option defaults totrue. This property is ignored unlessmodeis set toloadOnlyIncludedcsharp.debug.allowFastEvaluate- When true (the default state), the debugger will attempt faster evaluation by simulating execution of simple properties and methods.
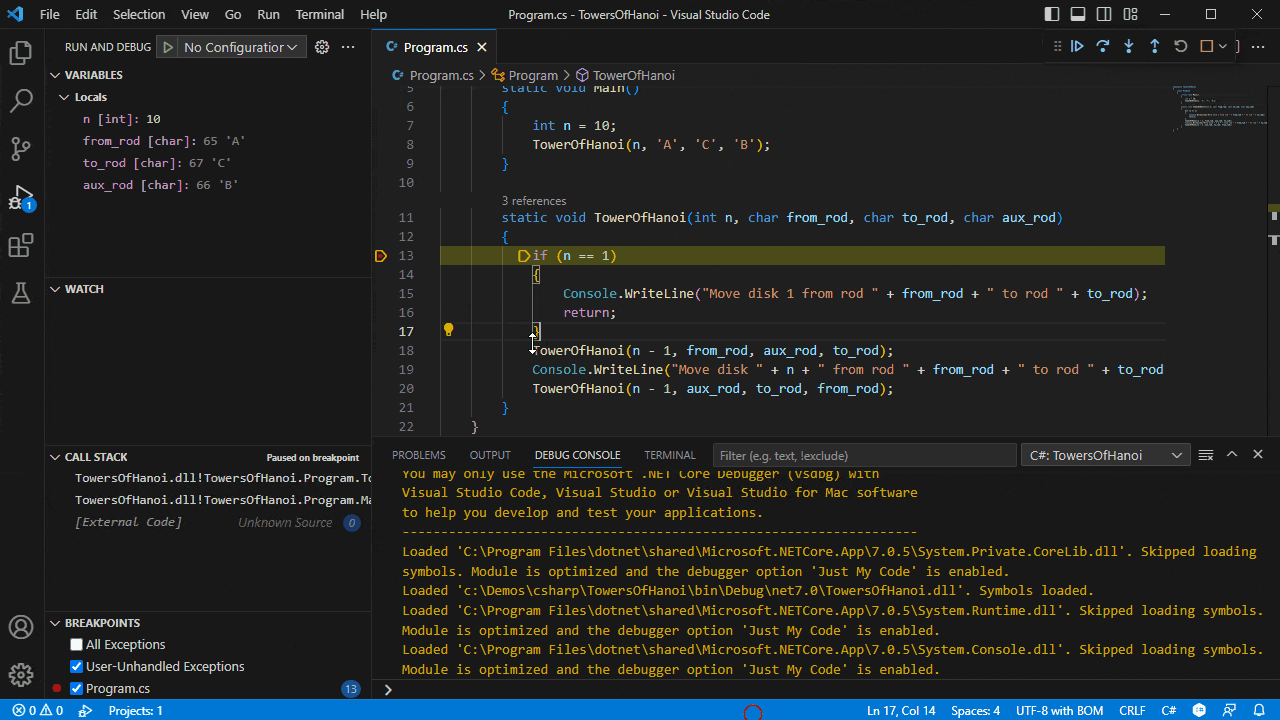
Breakpoints
The C# Debugger supports various breakpoints, such as source line breakpoints, conditional breakpoints, and logpoints.
Breakpoint - conditional breakpoint
With the help of expression evaluation, the debugger also supports conditional breakpoint. You can set your breakpoint to break when expression evaluates to true.
Breakpoint - Logpoints
Logpoints (also known as Tracepoints in Visual Studio) allow you to send output to Debug Console without editing code. They're different from breakpoints because they don't stop the execution flow of your application.
To add a Logpoint, right-click in the far-left margin next to a line of code. Select Add Logpoint and type the message you want to log. Any expression between curly braces ('{' and '}') will be evaluated when the Logpoint is hit.
The following tokens are also supported in the log message:
| Token | Description | Example Output |
|---|---|---|
| $FILEPOS | Current source file location | C:\sources\repos\Project\Program.cs:4 |
| $FUNCTION | Current function name | Program.<Main>$ |
| $ADDRESS | Current instruction | 0x00007FFF83A54001 |
| $TID | Thread ID | 20668 |
| $PID | Process ID | 10028 |
| $TNAME | Thread name | <No Thread Name> |
| $PNAME | Process name | C:\sources\repos\Project\bin\Debug\net7.0\console.exe |
| $CALLER | Calling function name | void console.dll!Program.Foo() |
| $CALLSTACK | Call stack | void console.dll!Program.Bar() void console.dll!Program.Foo() void console.dll!Program.<Main>$(string[] args) [External Code] |
| $TICK | Tick count (from Windows GetTickCount) | 28194046 |
| $HITCOUNT | Number of times this breakpoint has been hit | 5 |
Expression evaluation
The debugger also lets you evaluate expressions in the WATCH window as well as the Debug Console.
Next steps
Read on to find out about:
- Debugging - Find out how to use the debugger in VS Code with your project for any language.